In a production environment, downtime is unacceptable. It can lead to a massive loss in business revenue and reputation. But if you have a proper logging and monitoring system in place, you will know how to debug such scenarios, which lead to downtime. It helps in saving costs and identifying issues that might occur in the future. Nowadays, every size an organization is using DevOps principles and tools. Containers and Kubernetes are the most popular ones. And monitoring of such a system is done very efficiently with Prometheus. But where Prometheus lags is the logging part. It doesn’t provide a centralized logging system, and this is where Loki comes into the picture.
What is Grafana Loki?
Grafana Loki is a multi-tenant log aggregation system started by Grafana in 2018 and released under the Apache 2.0 license. This system was developed by getting inspired by Prometheus. It is majorly used with cloud providers and with tools like Prometheus and Grafana. Loki is similar to ELK/EFK stack, but it is easier to set up and operate with better functionalities. Loki does not index the content of the log, rather it indexes timestamps and a set of labels for a log stream. It makes the index smaller, which simplifies the operations and eventually lowers the cost.
Loki Benefits
Below are the benefits of using Loki in your stack:
By indexing only metadata, Loki is very cost-effective. Running indices for full-text processing requires larger RAM instances which are very expensive. Storing logs on objects stored like S3 also makes it very cheaper.It supports multi-tenancy by using tenantID, so tenants have their data stored separately.You can run Loki locally for small-scale operations or easily scale it horizontally for large-scale operations.It uses dynamo-style to ensure quorum consistency for reading and write operations.It is by default configured to have 3 replicas of logs to meet the risk of process crashes and abrupt exits where the logs get lost. Yes, it would incur some extra expense but not that high, integrity of data is more critical.Easy to plug with popular tools like Kubernetes, Prometheus, and visualization in Grafana.
Loki Architecture
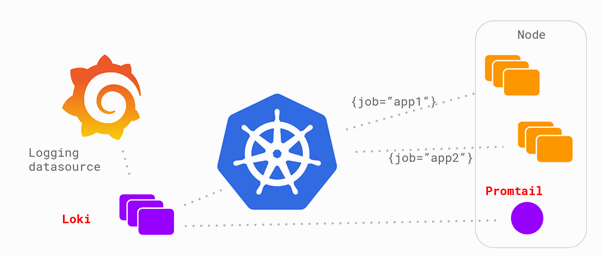
The Loki architecture has three components – Promtail, Loki, and Grafana. Promtail is an agent that has to be installed on each node running your applications or services. The primary responsibility of Promtail is to discover the target, attach the labels to the lo streams coming from the pods and push those logs to the Loki instances. The agent promtail tails the logs from the local file system and pushes the logs to Loki’s central server. After this, you can query back your logs using Grafana.
Loki Use Cases
Below are the popular use cases for using a logging system like Loki.
Business Intelligence: This is an evergreen use case, creating actionable insight from log data can always be very useful. Loki can help in understanding log data and make you capable of creating new strategies for business growth. For example, through log data of an organization, can help you know the conversion rates from an advertising channel.Monitoring: Prometheus is used a lot in the industry for monitoring. But you can identify a lot of things by monitoring your logs with tools like Loki. It can help you monitor the error rates on your website by going through the logs and sending alerts once the threshold is crossed.Debugging and Troubleshooting: Loki can help the DevOps team with some quick answers such as when did the app crash, the reason for its crash, its last status before crashing, etc.Cyber Security: In the last few years, cyber-attacks on e-commerce portals have increased exponentially. With the help of Loki, you can check on the logs to identify any threat or issue, or malicious activity happening in your organization’s system. If the hack was successful, Loki could still be helpful for the forensics team to understand what took place in the system in detail. It will help them in tracing back the hackers.Compliance: To comply with the industry regulations, the organizations must keep their audit logs for up to 7 years. The local authorities can audit the logs anytime. Loki can store your audit logs safely.
Installing Loki and Promtail
Let’s quickly find out how to install and visualize logs on Grafana. In this demonstration, I will use the generic configuration which will scrape the logs from /var/log/*log Go to the Loki releases page, scroll down to Assets, here you will find multiple Loki and Promtail packages. Download the Loki package according to the system you are using. Do not download cli or canary Loki packages. I am downloading loki-linux-amd64.zip and promtail-linux-amd64.zip for my Ubuntu system. After downloading finishes, extract the files of Loki and Promtail, and put them in a single directory. Now, download the generic configuration file of Loki and Promtail. To start Loki, run the command below with the Loki configuration file. This will start Loki and displays the Loki logs in the terminal. To start Promtail, run the command below with Promtail configuration file. Promtail is required to get the logs into Loki.
Visualize Log using Loki and Grafana
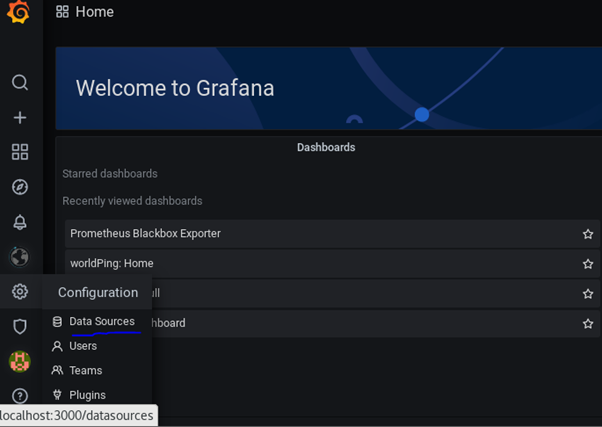
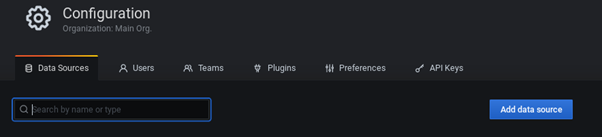
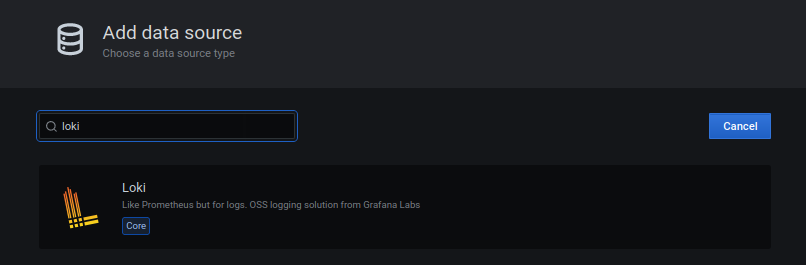
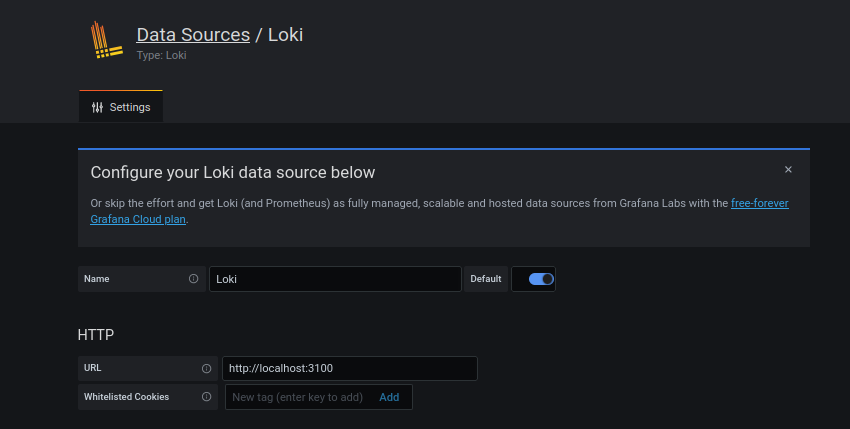
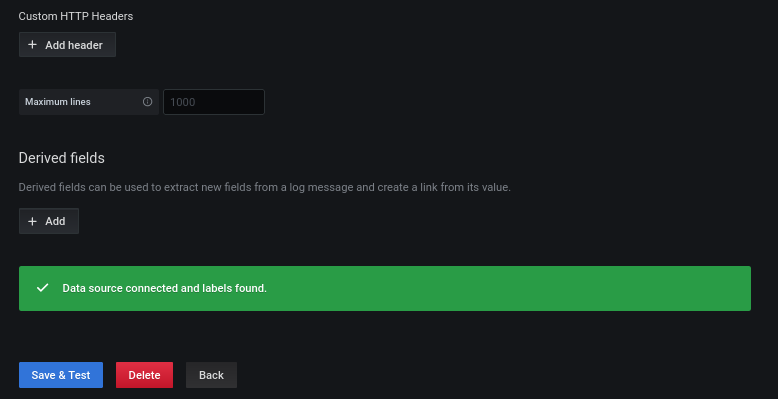
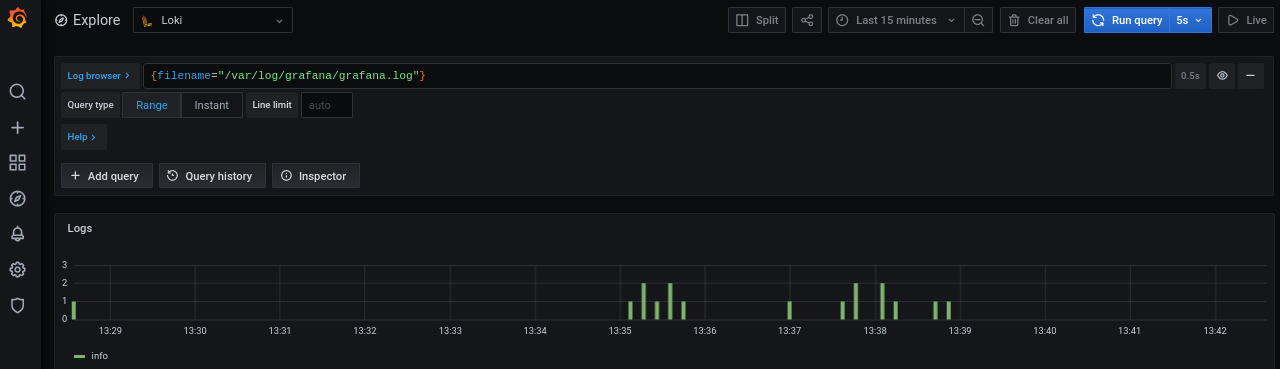
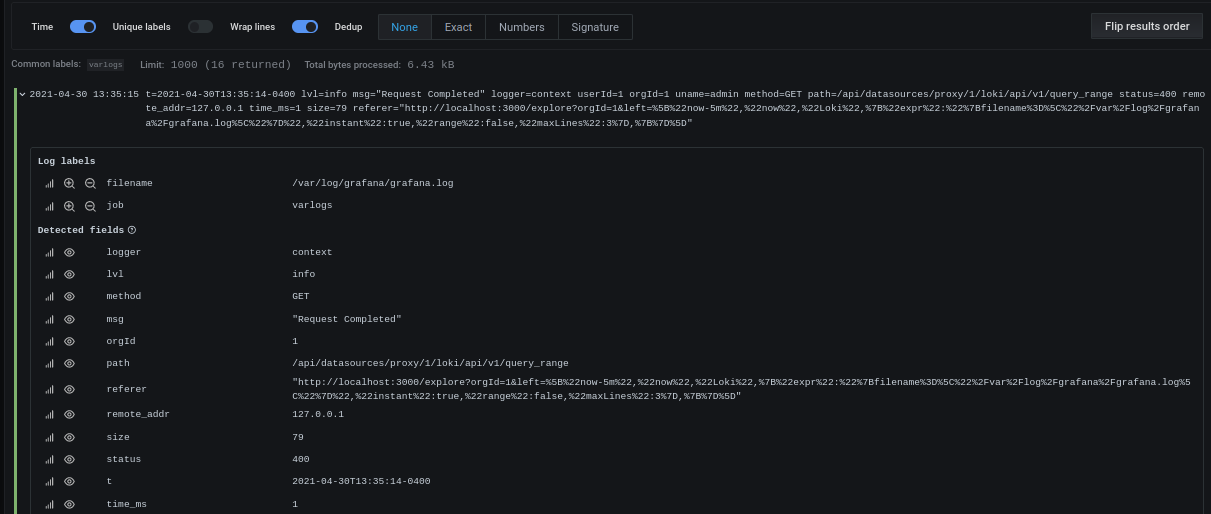
Grafana provides built-in support for Loki. Loki is already present in the data sources of Grafana. Step 1: Go to Grafana Configurations and Click on “Data Sources”. Step 2: In Data Sources, you can search the source by name or type. Step 3: Search by the name Loki. You can see this data source is already present in Grafana. Click on Select. Step 4: Enter the name you want to give to the data source and put http://localhost:3100 (change this to server IP if Loki is running on a different server than Grafana) in the URL because we have started Loki on port 3100. Click on the Test and Save button at the bottom. If you have done the Loki set up correctly, you will get the below message shown in a green box. Step 5: Click on the Explore tab on the left side. Select Loki from the dropdown of data source selection. Now, I would like to visualize the activity of Grafana logs. To do this, you need to add the query {filename="/var/log/grafana/grafana.log"} in the Log Browser. The green bars below are entries of events in the log file. You can select the time range for which you want the visualization to come on the dashboard, and you can also set the refresh interval of the query, after which the query will run again. To see more details of the logs, scroll down and click on one of the log entries, it will give all kinds of information related to the log. Looks beautiful, isn’t it? So, that was all about getting started. I would strongly advise you to further check out the below webinar video explaining observability with Loki.
Conclusion
A distributed system is composed of many applications or microservices, each one having tons of logs. You would need a cost-effective way to collect the logs, store them and then make use of them. Loki is a perfect solution for such cases. As a point of fact, you can reduce around 75% of your logging and monitoring costs by integrating Loki into your production environment. Loki is also available through Grafana Cloud, it would be good to try it out if you don’t want to go through the installation process. Next, get to know Grafana Tempo.
![]()
![]()


![]()
![]()
![]()
![]()

![]()


![]()
![]()
![]()

